Анализа видеопотока
Группа метрик анализирующих компоненты видеопоток.
YUV Values
YUV refers to a particular a way of encoding color information in analog video where Y channels carry luma (or brightness information), and U and V channels carry information about color (or chroma).
QuaCheck analyzes the YUV Values of a particular encoded video file in order to provide information about the appearance of the video. These metrics examine every pixel in a given channel and record the Maximum, Minimum, and Average values.
Note
An 8-bit video will have values falling in the range of 0-255 code values per pixel.
For 10-bit video, these numbers will instead be represented on a 1-1023 scale
| NAME | DESCRIPTION |
|---|---|
| min | Display minimal value contained within the input frame |
| low | Display value at the 10% percentile within the input frame |
| avg | Display average value within the input frame |
| high | Display value at the 90% percentile within the input frame |
| max | Display the maximum value contained within the input frame. |
Y: min, avg, max
Y Channels carry data about the brightness of a picture. Problematic variance in Y Channel values will manifest as a picture that is either too light or too dark, also known as containing luma noise.
A picture with well-balanced light levels will have an average, or mid-range Y Channel value of around 128 (Y AVG).
Graph readings outside of that range will indicate a picture that is either too bright or too dark.
A Y Value of 0 would indicate total blackness and a value of 255 would present as entirely white.
In the range of values, reference black is at value 16, while reference white is at value 235.
Except during particular moments like scene changes where one might expect abrupt spikes , the average values of Y channels should remain relatively stable or constant with little variation.
Portions of video showing extreme changes in average values (and not corresponding to a scene change or otherwise dramatic edit) likely indicate a picture error.
Where you may expect luma spikes could be camera fade-ins/outs, or a sudden brightness in the picture, like a camera flash, for example.
U/V: min, avg, max
The U and V Channels represent the chrominance, or color differences of a picture. U and V metrics act to detect color abnormalities in video. It can be difficult to derive meaning from U or V values on their own, but they provide supplementary information and can be good indicators of artifacts, especially when occurring in tandem with similar Y Value readings.
Black and white video contains no chrominance information so these metrics should produce flat lines (or “no data”) for UV channels.
Activity in UV Channels for black and white video content, however, would certainly be an indication of chrominance noise. Alternatively, a color video showing flat lines for these channels would be an indicator of a color drop-out scenario.
Y/U/V: low, high
This metrics works in a similar fashion as the Y,U,Vmin and Y,U,Vmax metrics, but instead of looking at the absolute minimum and maximum value for these channels, it looks at the 10th percentile (LOW, or 16 pixels) and 90th percentile (HIGH, or 235 pixels) which present the outside limits or ‘headroom’ of the legal broadcast range.
An extreme minimum or maximum value could dramatically skew the graph but because they may be outside the viewable broadcast image (or the range of human perception), they may not necessarily be meaningful indicators of a problematic visual image that can be human-detectable.
Note
LOW/HIGH measurements are useful because they ignore the extreme outliers (MIN/MAX) in favor of those abnormalities which fall in the range of human perception.
"Default" profile
In the default profile are set two warning conditions for each channel, to show the broadcast white and black, range limits of the chroma planes:
-
Ymin limit is set to 16 (the equivalent of 7.5 IRE)
-
Ymax limit is set to 235 (the equivalent of 100 IRE)
-
Umin limit is set to 16
-
Umax limit is set to 240
-
Vmin limit is set to 16
-
Vmax limit is set to 240
Tip
That these limit are only applicable to content that is decoded as broadcast range. Content marked as full range may appropriately exceed these limits.
Y/U/V: diff
This QuaCheck metrics selects two successive frames of video and subtracts the values of one from the other in order to find the change, or difference, between the two frames (measured in pixels).
This information is meaningful in that it indicates the rapidity with which a video picture is changing from one frame to the next. Aside from scene-change scenarios, a video picture should not undergo dramatic changes in these values unless an artifact is present. A scene-change would present as a short but dramatic spike in the graph, and that is normal.
Other YUV Difference spikes may be present in cases where picture problems are visible. Often, head problems with corrupted frames will result in large YUV Difference values/graph spikes.
Ydif = Difference of Y Channel between two frames
Udif = Difference of U Channel between two frames
Vdif = Difference of V Channel between two frames
Saturation
| Metrics | Name | Range |
|---|---|---|
| Saturation | SAT | [0-181.02] |
Saturation is a measure of the degree to which a color is diluted with white light; in other words–how vivid or ‘true’ a color is.
A Saturation rate of 128 is considered illegal because data in this range can’t be translated to/from camera data, and a videotape is technically incapable of storing values in this range (or beyond).
"Default" profile
In the default profile are set two warning conditions, to denote specific ranges of saturation levels:
- SATmax limit is set to 89 - represents the approximate limit of broadcast-safe saturation. Color bars at 75% should plot at this level.
- SAThigh limit is set to 118 - to mark the limit of the YUV colorspace in bt601 to properly convert back to RBG and saturation levels that exceed this limit would result in either negative or overflow numbers when converted back to RGB and thus need to be clipped.
Hue
| Metrics | Name | Values |
|---|---|---|
| Hue | HUE | [0-360] |
‘Hue’ is a term used to describe color; “Blue” or “Red” can be thought of as Hues.
The hue metrics shows the average (avg) and median (med) hue. The hue metrics quantifies hue in radians from 0-360 with:
-
green at 38 degrees
-
yellow at 99 degrees
-
red at 161 degrees
-
magenta at 218 degrees
-
blue at 279 degrees
-
and cyan at 341 degrees
In analyzing video, human skin is often a good baseline against which to measure appropriate color representation. Skin hue should fall in the 143-148 range; if skin registers significantly above or below that range, it’s likely an indication that your video isn’t accurately storing or displaying color data accurately.
Temporal Outliers
| Metrics | Name | Range |
|---|---|---|
| Temporal Outliers | TOUT | [0-1] |
This metrics was created to detect white speckle noise in analog VHS and 8mm video.
It works by analyzing the current pixel against the two above and below and calculates an average value. A temporal outlier is a pixel unlike the neighboring pixels of the same field.
In cases where the metrics detects a pixel value which is dramatically outside of this established average, the graph will show small spikes, or blips, which correspond to white speckling in the video. Examples of temporal outliers include the results of video dropouts, head clogs, or tape tracking issues.
Info
The range of 0-0.009 could be considered normal and anything above that range may be a quality issue.
Vertical Repetitions
| Metrics | Name | Range |
|---|---|---|
| Vertical Line Repetitions | VREP | [0-1] |
Vertical Line Repetitions, or the VREP metrics detecting artifacts generated in the course of the digitization process. Specifically, VREP detects the repetition of lines in a video. If a time base corrector notices a video signal dropout, it will compensate by playing the same line of data several times, hence the appearance of repetitious lines.The metrics works by taking a given video line and comparing it against a video line that occurs 4 pixels earlier. If the difference in the two is less than 512, the metrics reads them as being close enough to be appear repetitious. Cleaning your deck and/or tape may remediate this problem.
Info
This metrics is useful with analog source content only.
In born-digital video vertical line repetition is common, but this pattern is uncommon in video digitized from an analog source.
When it occurs in video that results from the digitization of an analog source it can indicate concealment from a dropout compensator.
Broadcast Range
| Metrics | Name | Range |
|---|---|---|
| Broadcast Range | BRNG | [0-1] |
The BRNG metrics is one that identifies the number of pixels which fall outside the standard video broadcast range of 16-235 (8-bit); 64-940 (10-bit) pixels. Normal, noise-free video would not trigger this filer, but noise occurring outside of these parameters would read as spikes in the graph.
Info
Typically anything with a value over 0.01 will read as an artifact.
While the RANG metrics is good at detecting the general presence of noise, it can be a bit non-specific in its identification of the causes.
Cropdetect
Letterbox
This metics enables you to view which parts, if any, of your video which contain no picture data. In the case of letterboxing, for example, you’ll have black bars both above and below your picture. This metrics would detect and present that in the graph reading. Crop Height charts Top and Bottom crop.
Pillarbox
This metrics detects portions on either side of your video which may contain not contain any picture data. In the case of pillarboxing, for example, you’ll have black bars on the left and right sides of your video. This metrics will detect and present that information in the graph reading. Crop Width charts Right and Left crop.
Deflicker
This plots quantifies temporal frame luminance variations as the average mean of 5 frames at a time.
Blackdetect
Detect video intervals that are (almost) completely black. Can be useful to detect chapter transitions, commercials, or invalid recordings. Output lines contains the time for the start, end and duration of the detected black interval expressed in seconds.
The metrics accepts the following options:
min_duration
Set the minimum detected black duration expressed in seconds. It must be a non-negative floating point number.
Info
Default value is 2.0.
is_black
Set the threshold for considering a picture "black". Express the minimum value for the ratio black pixels / all pixels for which a picture is considered black.
Info
Default value is 0.98.
black_duration
Freezedetect
This metrics it detects that the input video has no significant change in content during a specified duration. Video freeze detection calculates the mean average absolute difference of all the components of video frames and compares it to a noise floor.
The metrics accepts the following options:
is_freeze Set noise tolerance. Can be specified in dB (in case "dB" is appended to the specified value) or as a difference ratio between 0 and 1.
Info
Default is -60dB, or 0.001.
freeze_duration
duration
Set freeze duration until notification
Info
Default is 2 seconds.
Peak Signal to Noise per Field (PSNR)
This metrics is helpful for detecting the lossinessof a video. Lossiness is a term often associated with the compression process and it refers to data or information that is lost when the video undergoes this process.
This metrics plots the Peak Signal to Noise Ratio between the video in field 1 (odd lines) versus the video in field 2 (even lines). Lower values indicate that field 1 and field 2 are becoming more different as would happen during a playback error such as a head clog.
Mean Square Error per Field (MSE)
This metrics is similar to PSNRf but reports on the Mean Square Error between field 1 and field 2. Higher values may be indicative of differences between the images of field 1 and field 2.
Structural SImilarity Metric (SSIM)
This metrics plots the Structural SImilarity Metric between the video in field 1 (odd lines) versus the video in field 2 (even lines). Lower values indicate that field 1 and field 2 are becoming more different as would happen during a playback error such as a head clog.
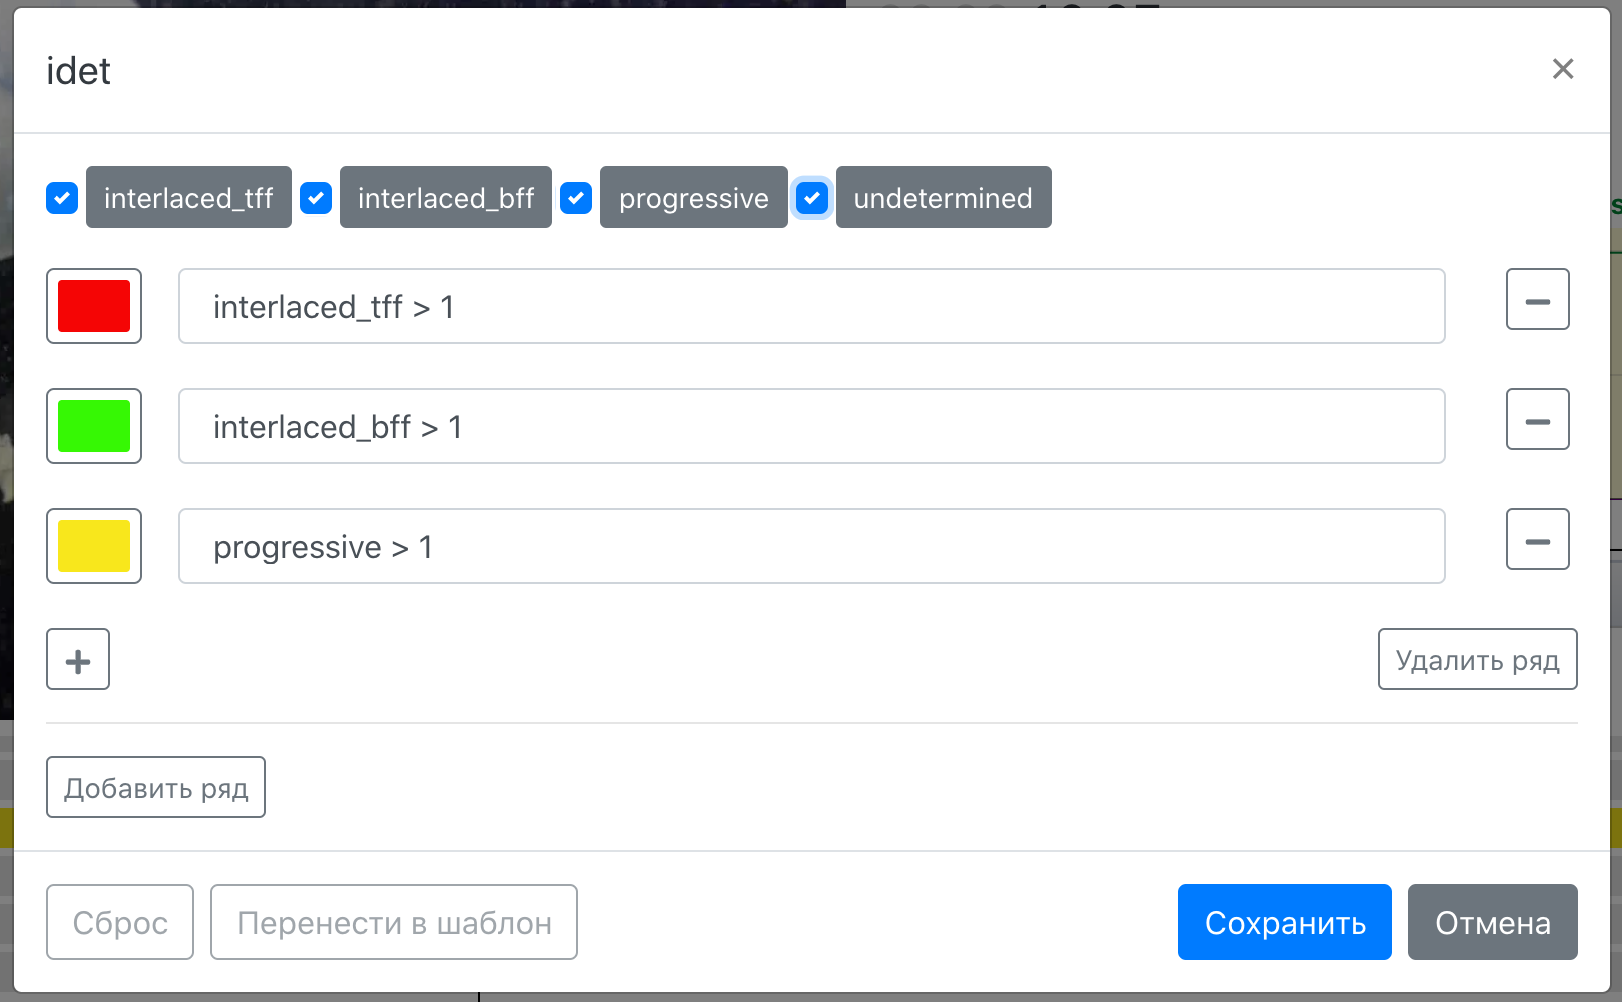
Interlacement Detection
This metrics tries to determine whether input frames are progressive or interlaced (first the upper or lower field) and assigns them the status progressive or interlaced respectively.
Frames that could not be classified get status undetermined.
The metrics accepts the following options:
| NAME | DESCRIPTION |
|---|---|
| interlaced_tff | Frame detected as top field first |
| interlaced_bff | Frame detected as bottom field first |
| progressive | Frame detected as progressive |
| undetermined | Frame that could not be classified |
"Default" profile
In the default profile are set three warning conditions:
-
green for bff frame
-
yellow for progressive frame
-
red for tff frame